
Forex Technical Analysis
Technical analysis is all about prices. It gives information about prices as a result of mathematical formulas and special indicators.
Formulas for technical analysis are simply applicable and, if known, the margin of error is almost minimal.
Different charts are used by investors in the market. This is because the instruments invested in are not the same as the expectations.
Investments in financial markets are made through online platforms. Technical analysis is also done through these platforms. By choosing the instrument you want to invest on the platform, you can perform the technical analysis you want on it. For example; When you select the price charts, a price/time chart will appear in the maturity range for which you have specified the instrument. The important thing is to interpret these graphics in the most accurate way and to gain profit with these graphic interpretations. If the charts are interpreted correctly (with the contribution of Fundamental analysis), you can make good profits.
Technical Analysis, which often seems complicated, can be learned easily with focused study and it is possible to become your own analyst. In this tutorial, we’ll cover the basics of technical analysis.
PRICE CHARTS
Price charts used in determining the values of investment instruments are general tools of technical analysis. They are used to determine the trend, to decide the support and resistance points, and to apply formation and special analysis. Investors use them to capture advantageous positions. Although there are many types of forex charts, candles, lines and bar charts are the most used. Thus, it is decided whether or not to enter the position according to the price signals received. In order to understand the language of graphics, we first need to know a few basic concepts.
These clutches are: TREND, SUPPORT- RESISTANCE, TREND LINES, PRICE CHANNELS
1-) TREND CONCEPT
The concept of trend means the direction of change in prices. According to the data in the chart, it is determined whether the trend will be down or up. Prices move in the normal steady state in some cases. Other than that, it is always wavy. Therefore, when you invest, you should determine the direction of the trend in the future. For this, you need to use price charts. Of course, in order to find the trend direction, the concepts that need to be known in other graphic languages are also important and must be taken into account.
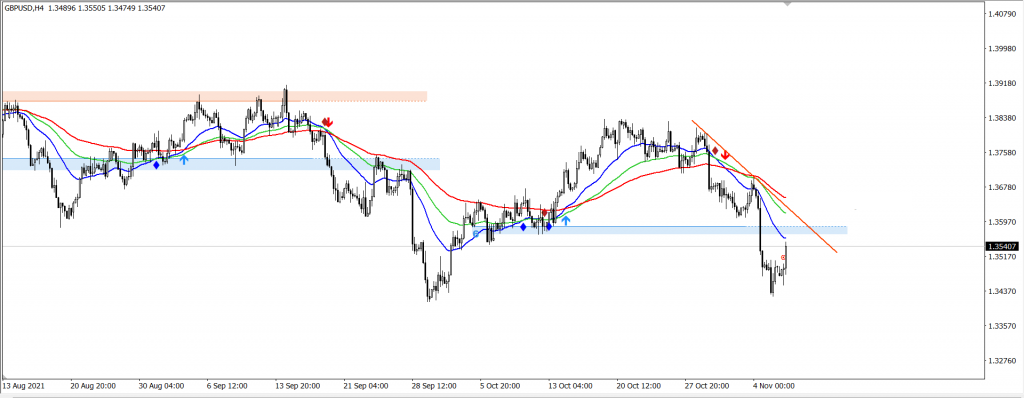
2-) SUPPORT RESISTANCE CONCEPT

While the price levels are in an uptrend, they are stuck at some points and experience a reversal movement. It’s hard to get to the top. At this point, since the price is showing resistance, it appears as a resistance concept on the chart.
That is, the price is in an uptrend; but if it cannot exceed the specified critical point, it is stuck at the resistance points. Usually, at this point, price levels corrective action. For this reason, investors think that the price will not increase, but will retreat, and apply a sell-side transaction.
Support is the opposite of resistance. It encounters hurdles when price levels start to trend downwards. It enters the corrective movement by finding support at the support points. Since the price is at a low level, purchases are usually made at these points. When it rises, sales are made and profit is made.
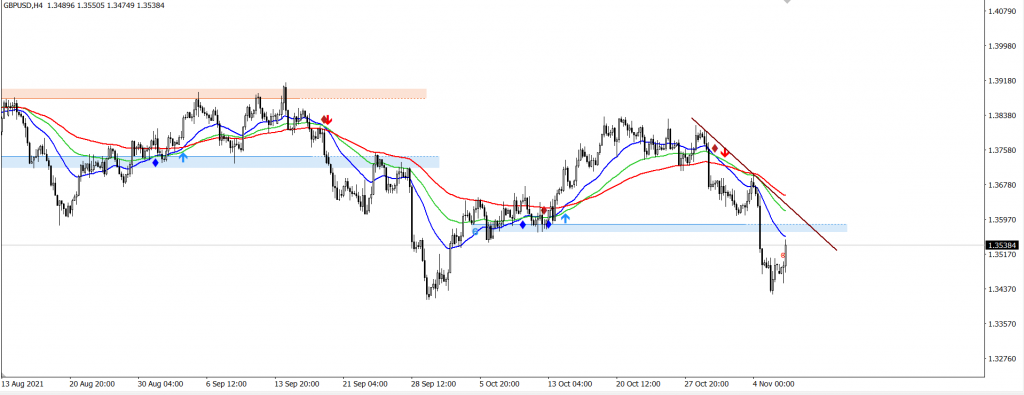
3-) TREND LINES
Trend lines are drawn on the chart based on the peaks and troughs. It is at the top when the price is at the high, and at the bottom when the price is at the low. By determining these points on the graph, an imaginary line is drawn over the platform. Accordingly, information about the trend direction of the price is obtained in the short term. If the direction of the line is straight when the high and low points of the falling price are combined, the positive opinion about the trend direction of the trend prevails. That is, the price is expected to rise in the future. On the contrary, even if the descending price lines are above the market price, it is thought that there will be a decrease. But of course, it is important in which direction other concepts move.
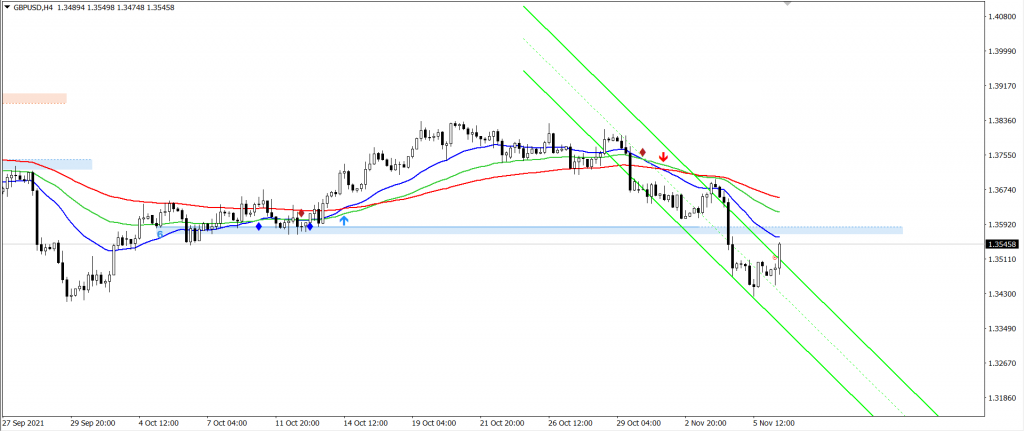
4-) PRICE CHANNELS

Price channels are used with trend lines. It provides information about the future period. Price channels are drawn parallel to trend lines. Thus, on the same plane, the points at which prices will rise or fall are determined. According to the determination result, if the trend is downward, the descending price channel will dominate the trend, and if it is upward, the rising price channel will dominate the trend. Although it may seem complicated, you can easily interpret whether it will be a decrease or an increase when you see it on the chart. These four concepts allow the interpretation of the resulting graph.
Of course, Technical Analysis is not just about these concepts, but knowing these concepts at a basic level allows you to roughly read the charts, do technical analysis and ultimately win.